

Two spots read 1.5 meters at the same time. At one, sets roll in that rip the board right out of your hands; at the other, mushy waves fall apart before they even get to you. The number is the same. The power isn't.
That's why we added energy to every spot page: a number in kJ that tells you how much power the ocean is bringing, not just how big it is.
Why 1 meter isn't 1 meter
Height is only part of the story. Three things change how hard a wave pushes:
- Period. It's the time between one wave and the next. A long-period swell, 12 or 14 seconds, comes from far away and moves a lot more water than a short one at 6 or 7, even if it's the same size. And it counts squared: out at sea, 1 meter at 8 seconds is about 126 kJ; 1 meter at 14 seconds, about 385. Same size, three times the power.
- Height, also squared: double the size means four times the energy.
- Where the swell comes from and how exposed the spot is. A swell that hits head-on unloads all its power; one that comes in from the side, or gets blocked by a point, an island or a jetty, arrives with much less. That's why energy is calculated for each spot: based on which way the beach faces and how much the coastline shelters it from each direction.
Lineup pulls all of that together, swell by swell, into a single number.
A clear example
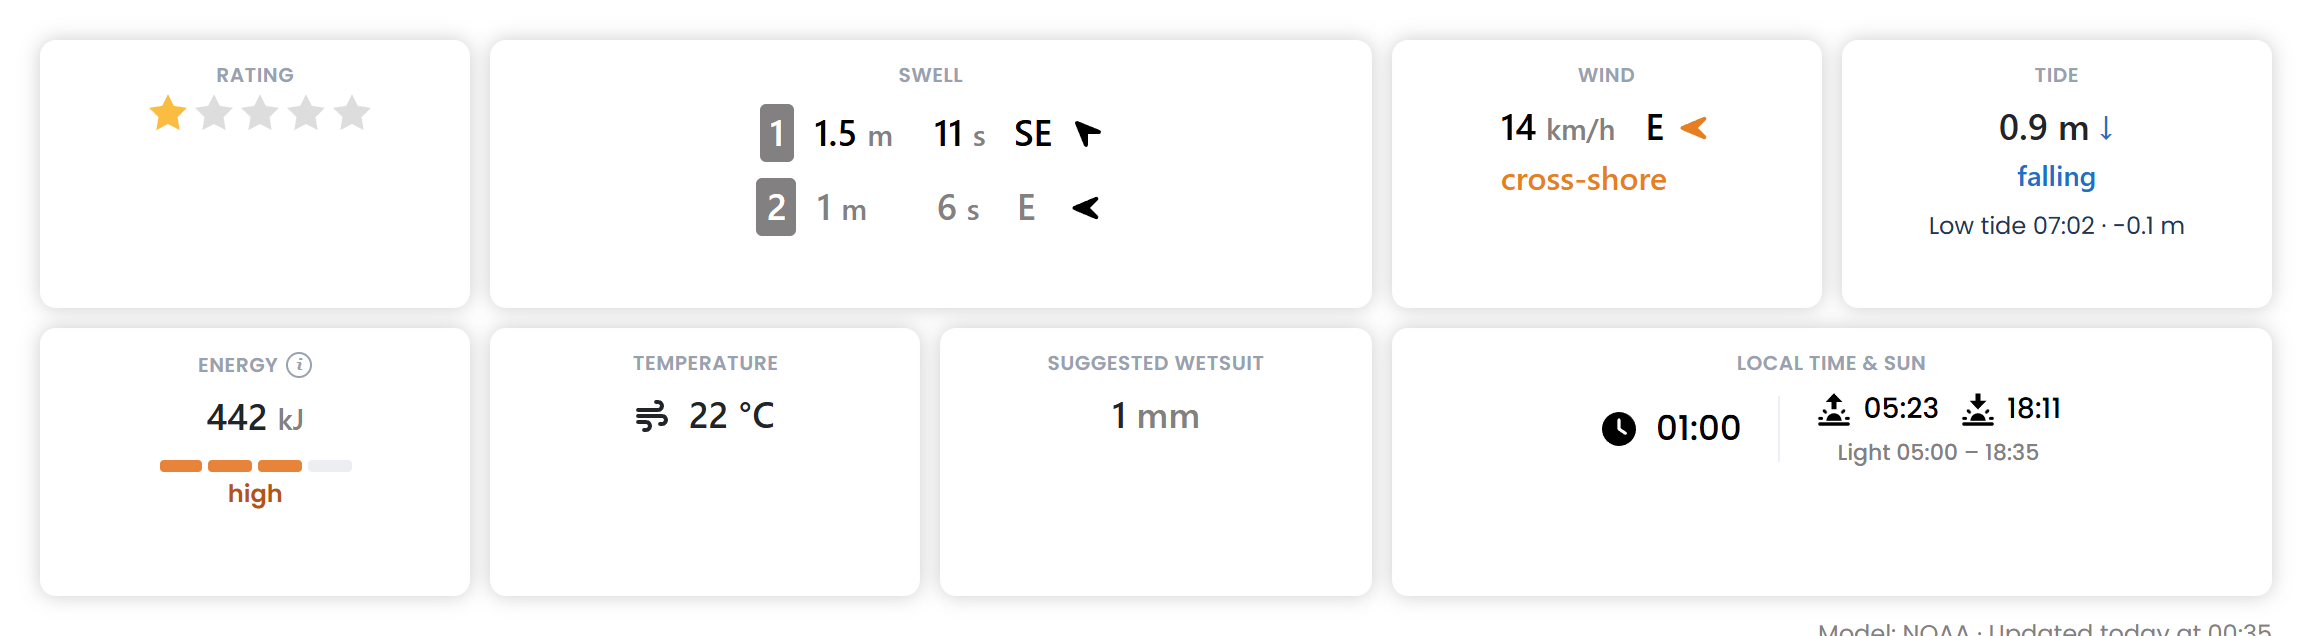
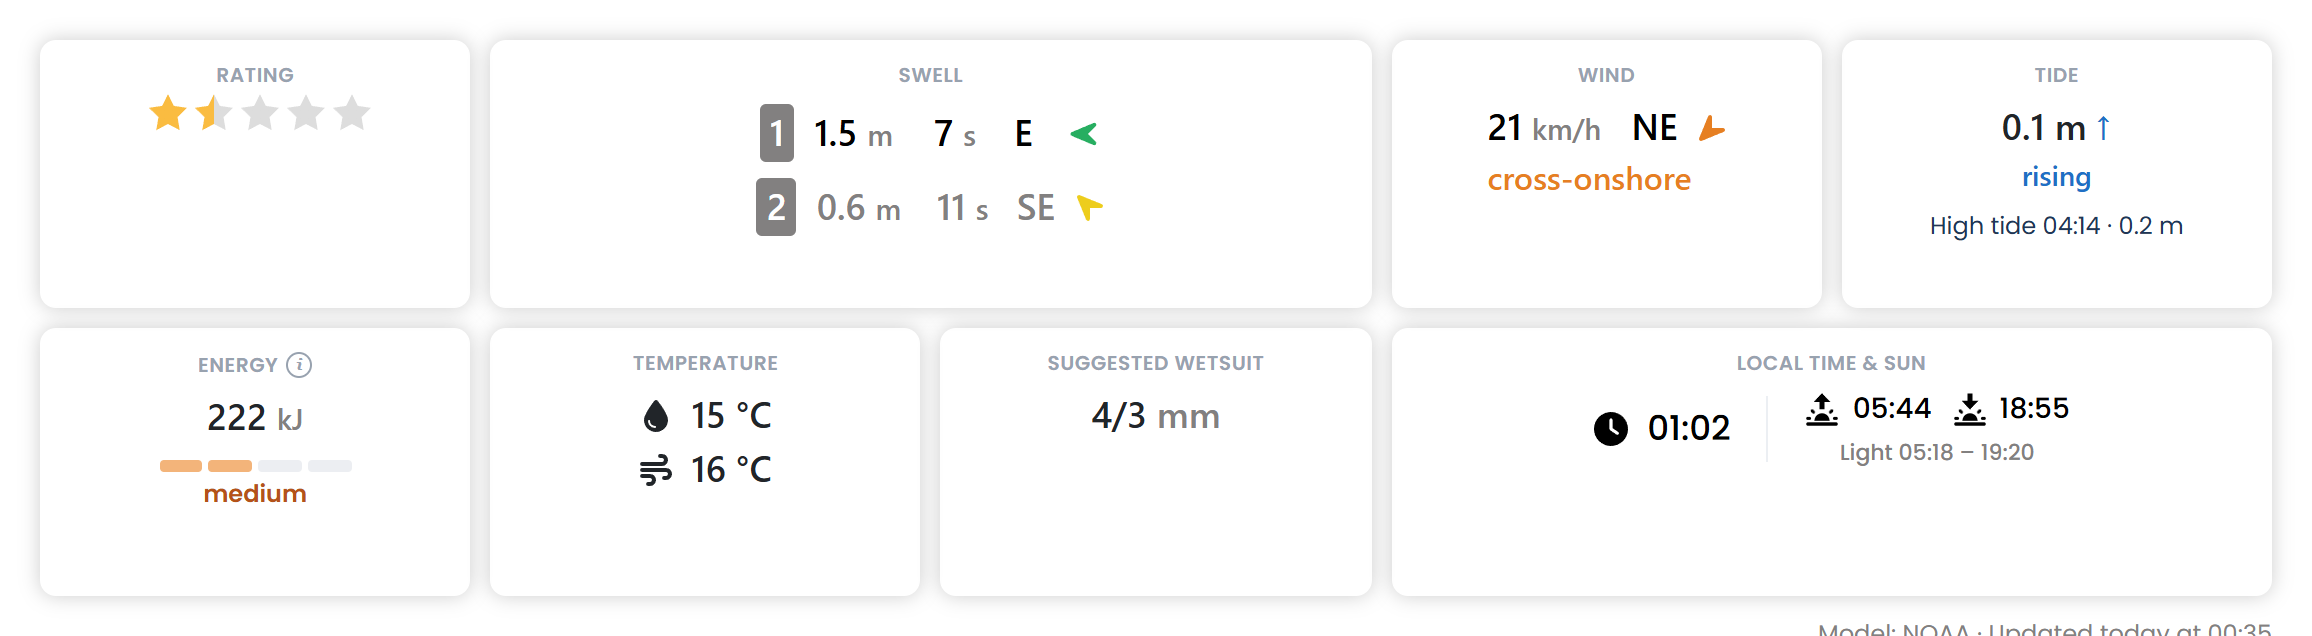
In the early morning of Friday 23/10/2026, Maresias (São Paulo, Brazil) and Playa del Barco (Rocha, Uruguay) had the same primary swell: 1.5 meters. Maresias was reading 443 kJ, high energy; Playa del Barco, 222 kJ, medium. Half. At Maresias the swell had a longer period (11 seconds vs. 7), plus a second swell that was pushing too.
How to read the kJ
In Current conditions, right after the tide, you'll find the Energy card: the number in kJ, a four-level bar and the name of the level.
- Low: under 100 kJ.
- Medium: 100 to 299 kJ.
- High: 300 to 999 kJ.
- Very high: 1000 kJ or more.
Tap the (i) and it shows you where the number comes from and how much each swell brings: "Swell 1: 233 kJ · Swell 2: 210 kJ".
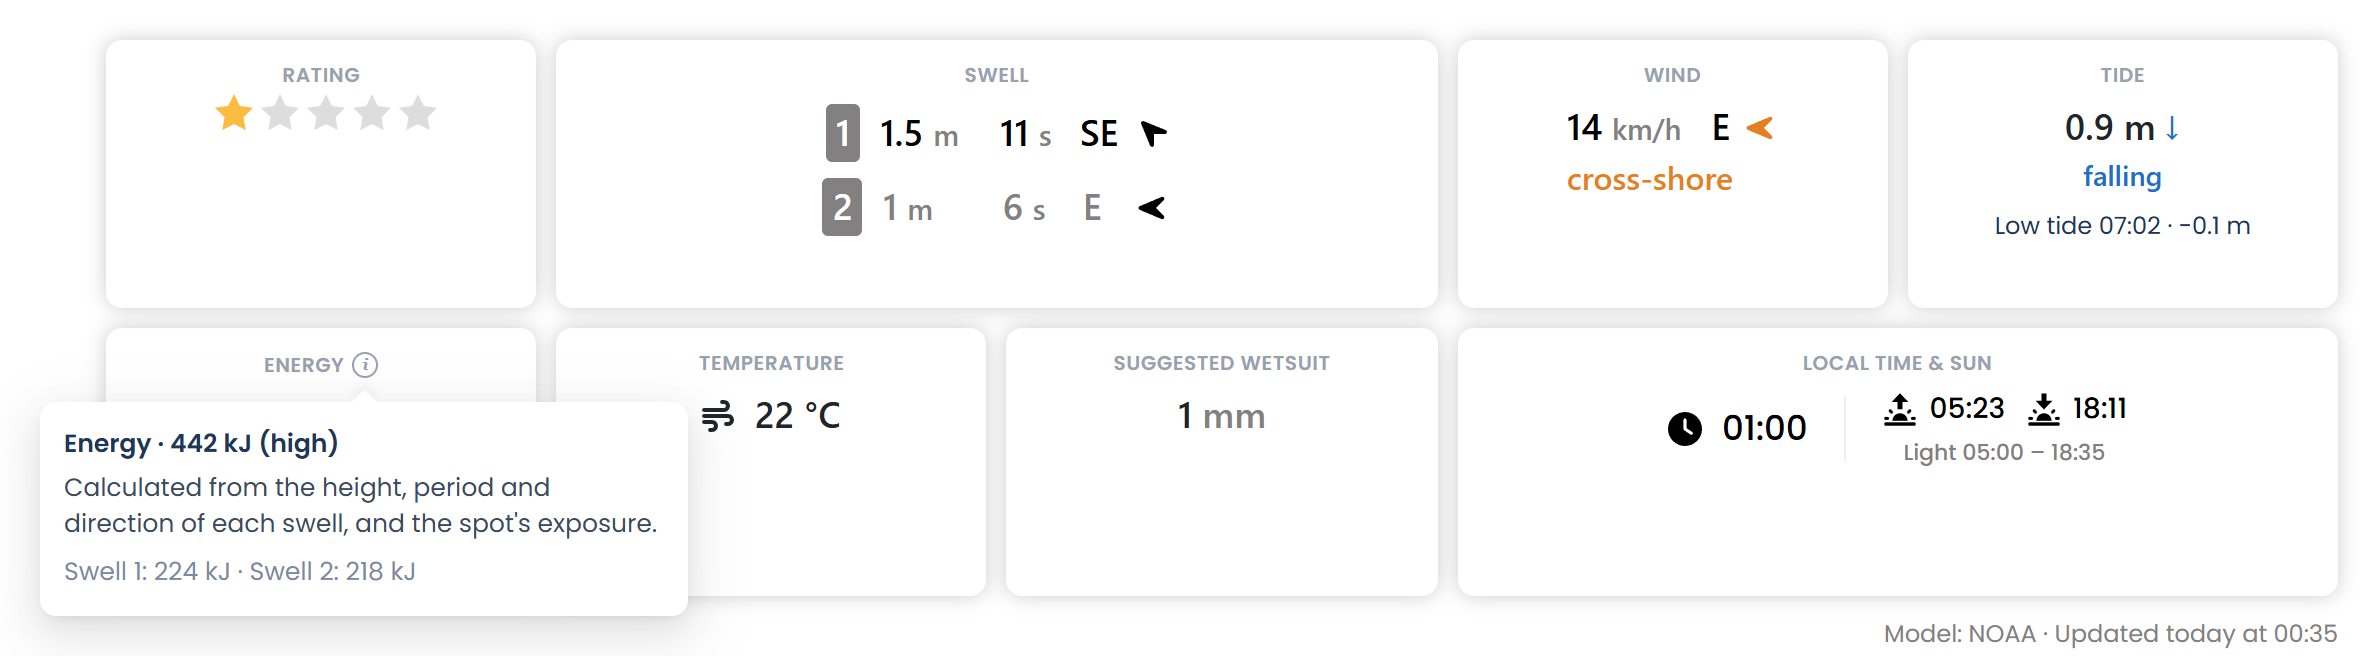
There's no good or bad number: it depends on the spot and on what you like to surf. The useful thing is to treat it as a reference. Check how many kJ your spot reads on the days it's firing and you'll know how to read the rest.
In the forecast, hour by hour
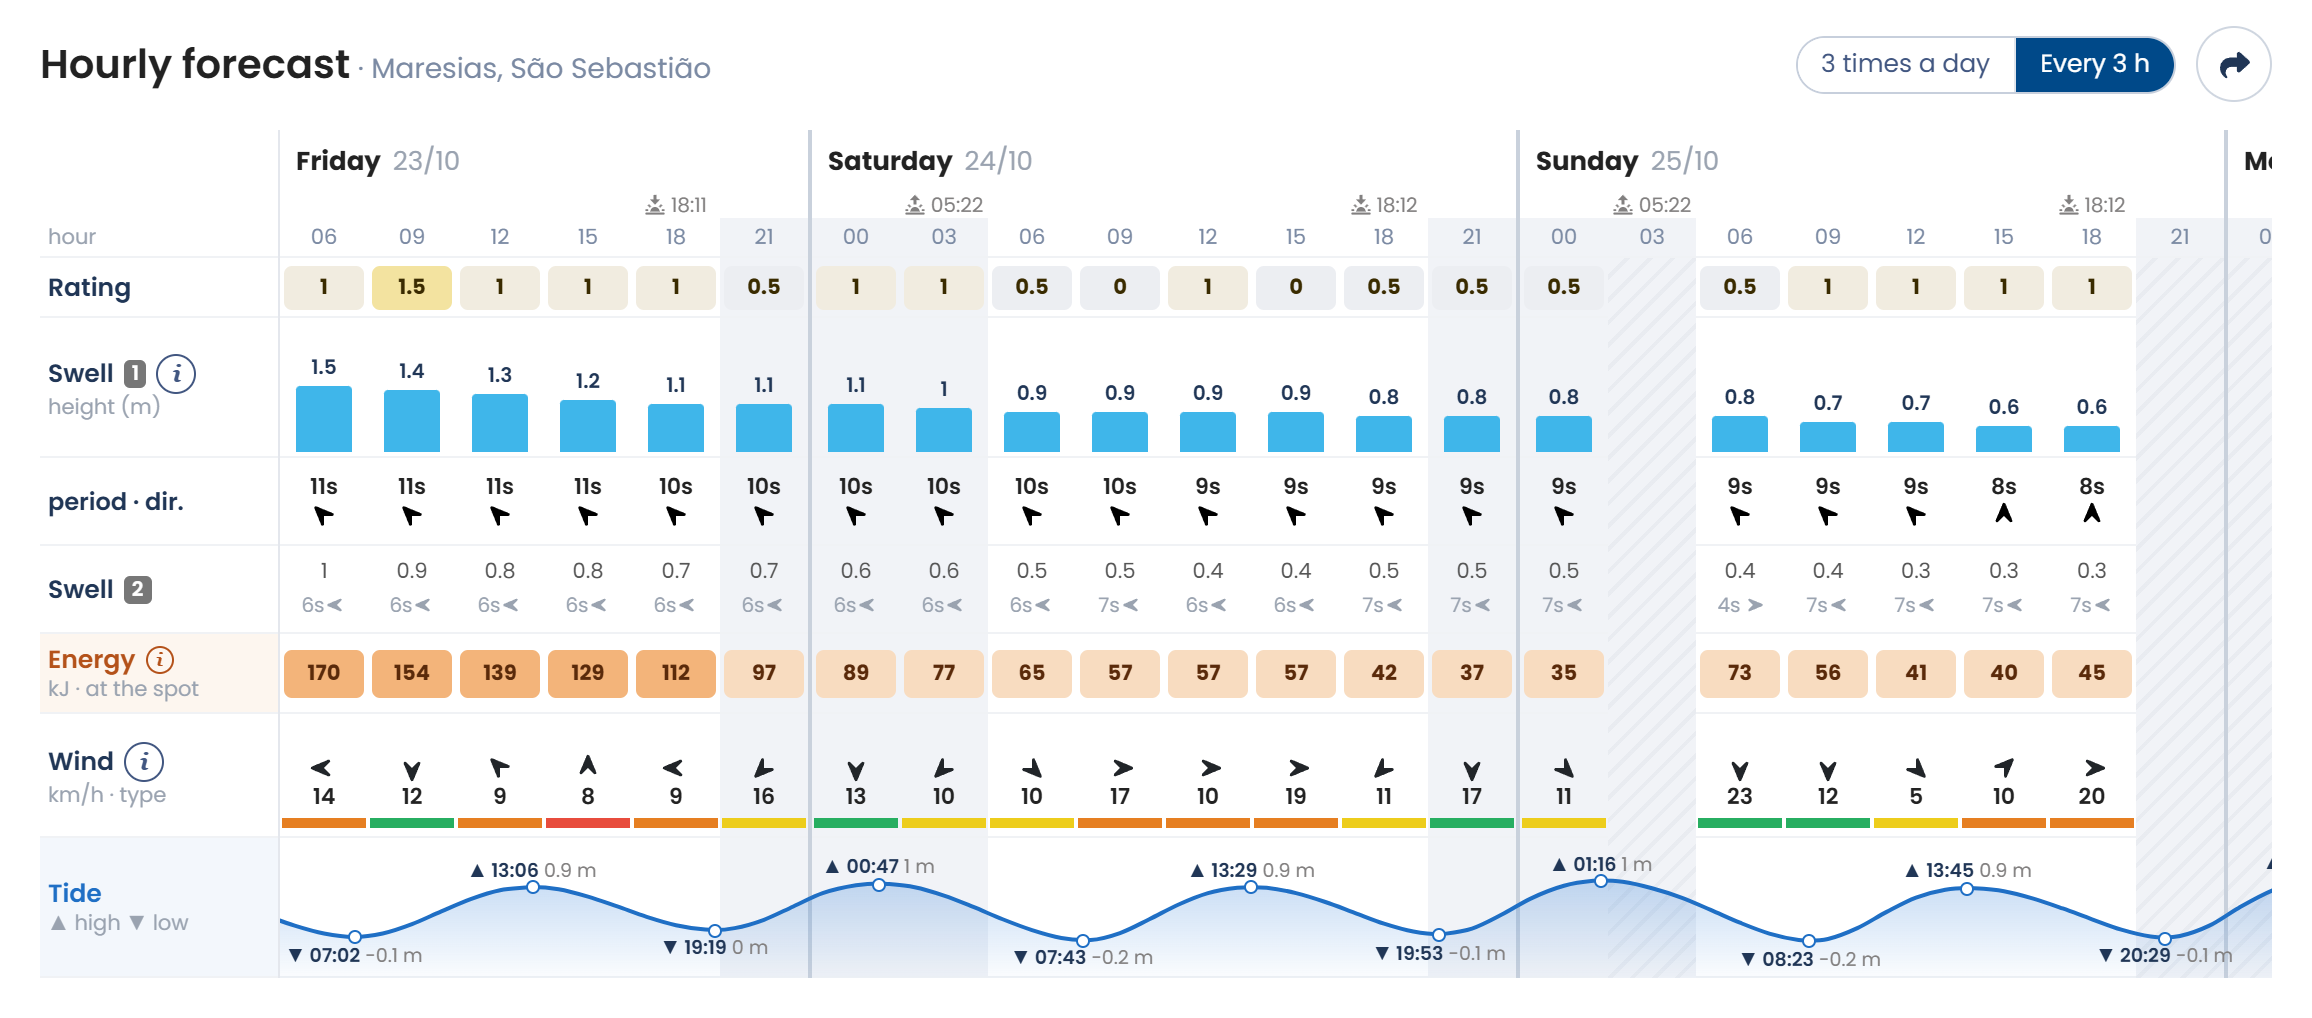
In the Hourly forecast there's a new row, Energy, below Swell 2: each time slot with its number and the color of its level, from cream for low energy to dark orange for very high. Hover or tap a column and the detail shows how much each swell brings. That way you can see at a glance when during the day the most power is coming in.
What does each plan get?
- Free: current energy and today's energy in the forecast.
- Premium: energy for all 10 days of the forecast.
Go to your spot's page and check how much energy it's bringing today.