

The same spot, with the same swell and the same wind, can be firing in the morning and shut down by the afternoon. A lot of the time, the difference is the tide.
On a rising tide, the water covers the sandbars again and the wave breaks cleaner. At low tide, some beaches close out or break over shallow water; at others, that's exactly when the wave shows up. Every spot has its tide, and the people who surf it regularly know it by heart. Now you have it on Lineup, on every spot's page.
Where the tide really matters
It doesn't move the same everywhere. On any given day in October, the difference between high and low tide is more than 3 meters in Las Grutas (Río Negro, Argentina) and almost 3 in Comodoro Rivadavia; around 1 meter on the Buenos Aires coast and in northeastern Brazil; and between 40 and 80 centimeters in Chile and Peru. In Uruguay the astronomical tide is small (20 to 40 centimeters): there, the water level is driven more by wind and pressure than by the moon, so the curve is real but almost flat.
How to read the curve
On the spot page, below Current Conditions, you'll find the Tide · today section:
- The red line is now, with the height and an arrow: ↑ if the tide is rising, ↓ if it's dropping.
- The peaks are high tides (▲) and the valleys are low tides (▼), each with its time and height.
- At the top right we tell you how long until the next one: "Next high tide in 2 h 2 min (17:33 · 4.2 m)".
- Below, there's a card for each high and low tide of the day; the ones that have already passed look lighter. The shaded area is nighttime.
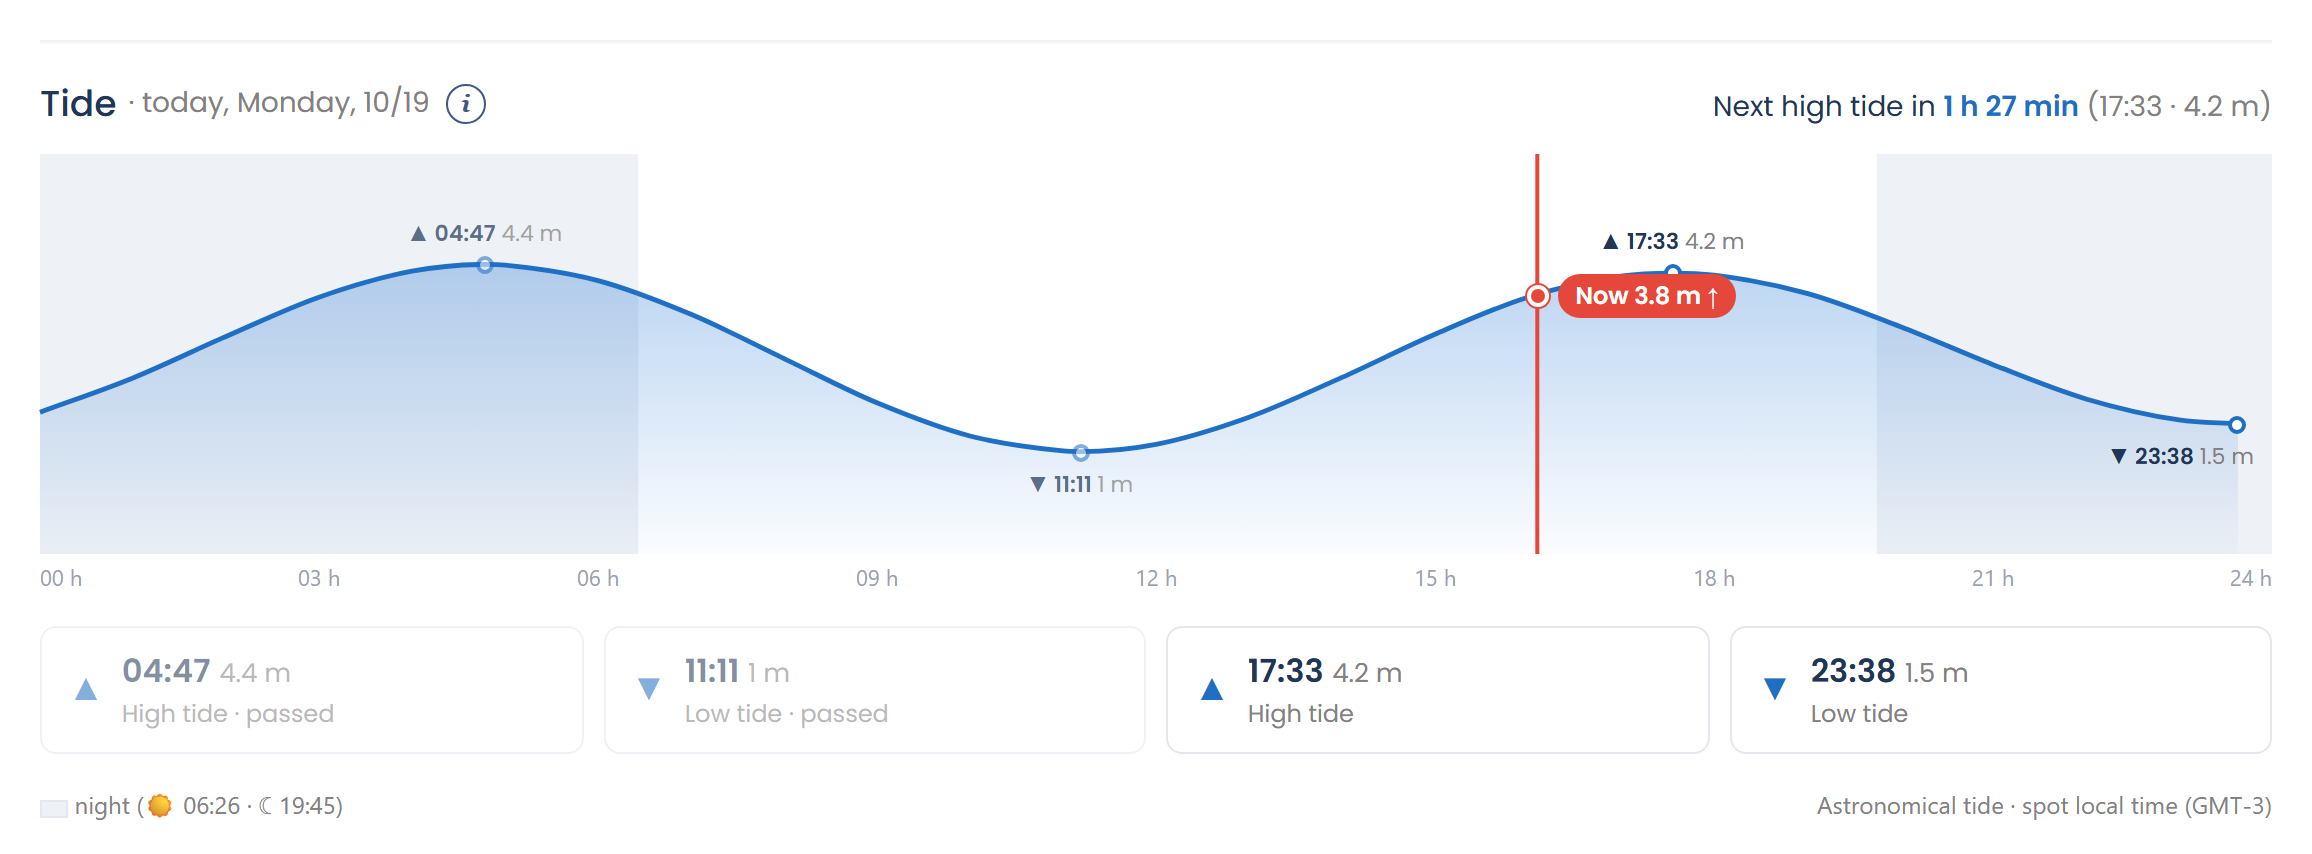
And in Current Conditions, the Tide card sums it up: the current height, whether it's rising or dropping, and the next high or low tide.
One detail: heights are measured from mean low water, so they may not match the harbor tide table, which uses a different zero. What matters is whether it's rising or dropping, and when.
How to read the column
The tide is also in the forecast, right next to the swell and the wind:
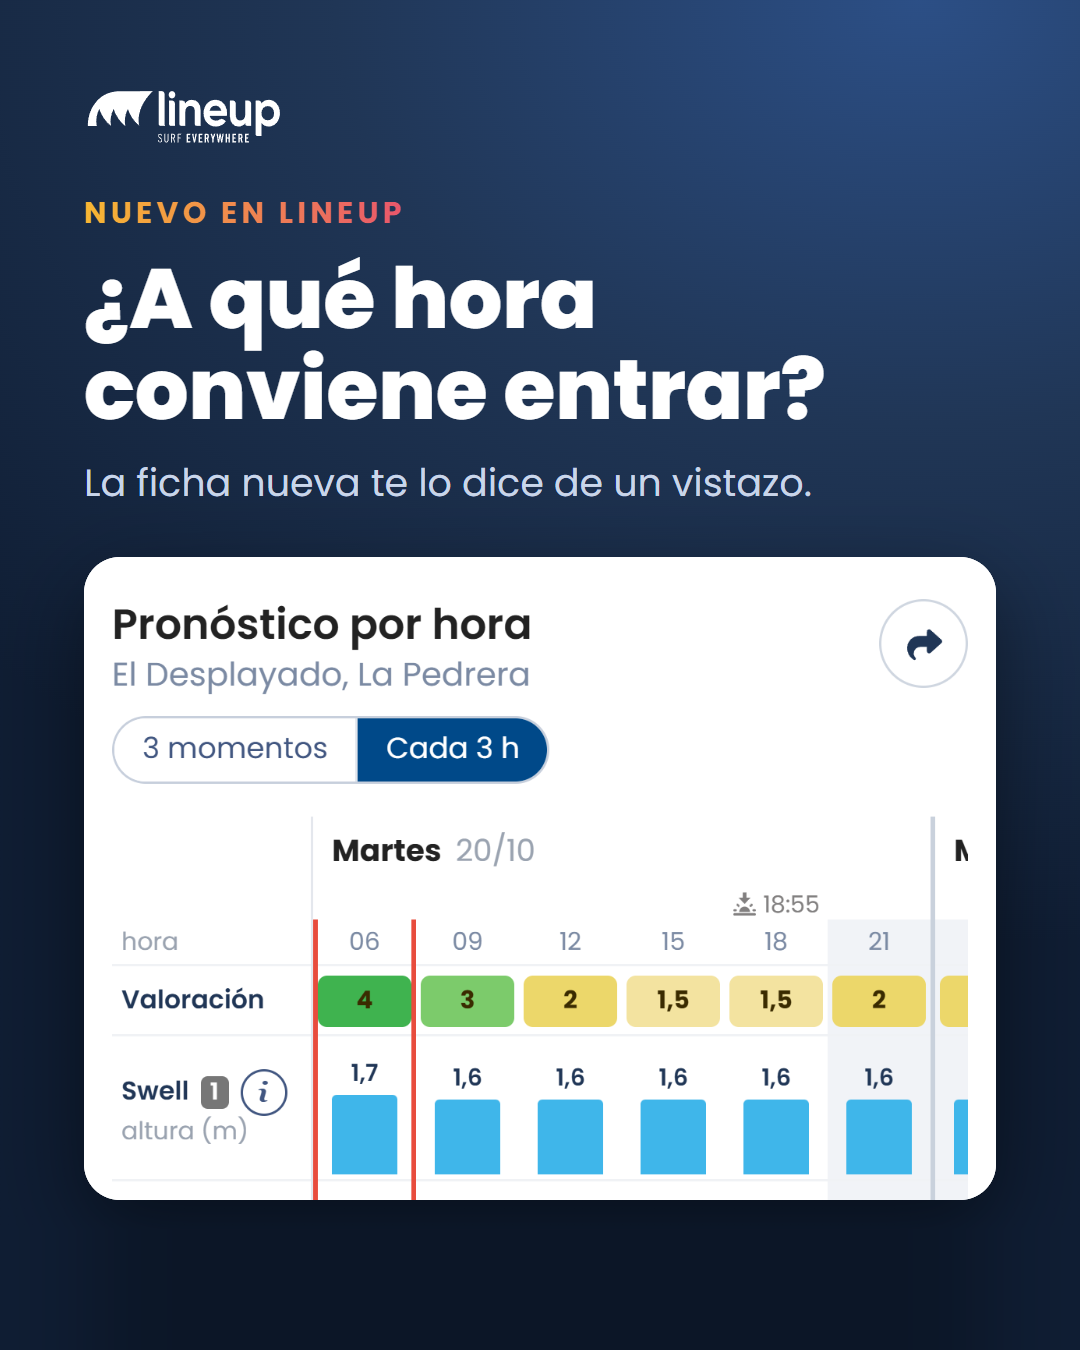
- In the Hourly Forecast, the last row is the tide. In "Every 3 h" it's a curve that runs from one day to the next, with high tide (▲) and low tide (▼) at their exact times. In "3 times a day", each column shows the height and whether it's rising or dropping.
- In the 10-Day Forecast, the Tide column shows the height for each time slot and an arrow: 3.1 m ↑ means that at that time there are 3.1 meters and the tide is rising. Tap it and it tells you what's next: "rising · High tide 17:33 · 4.2 m".
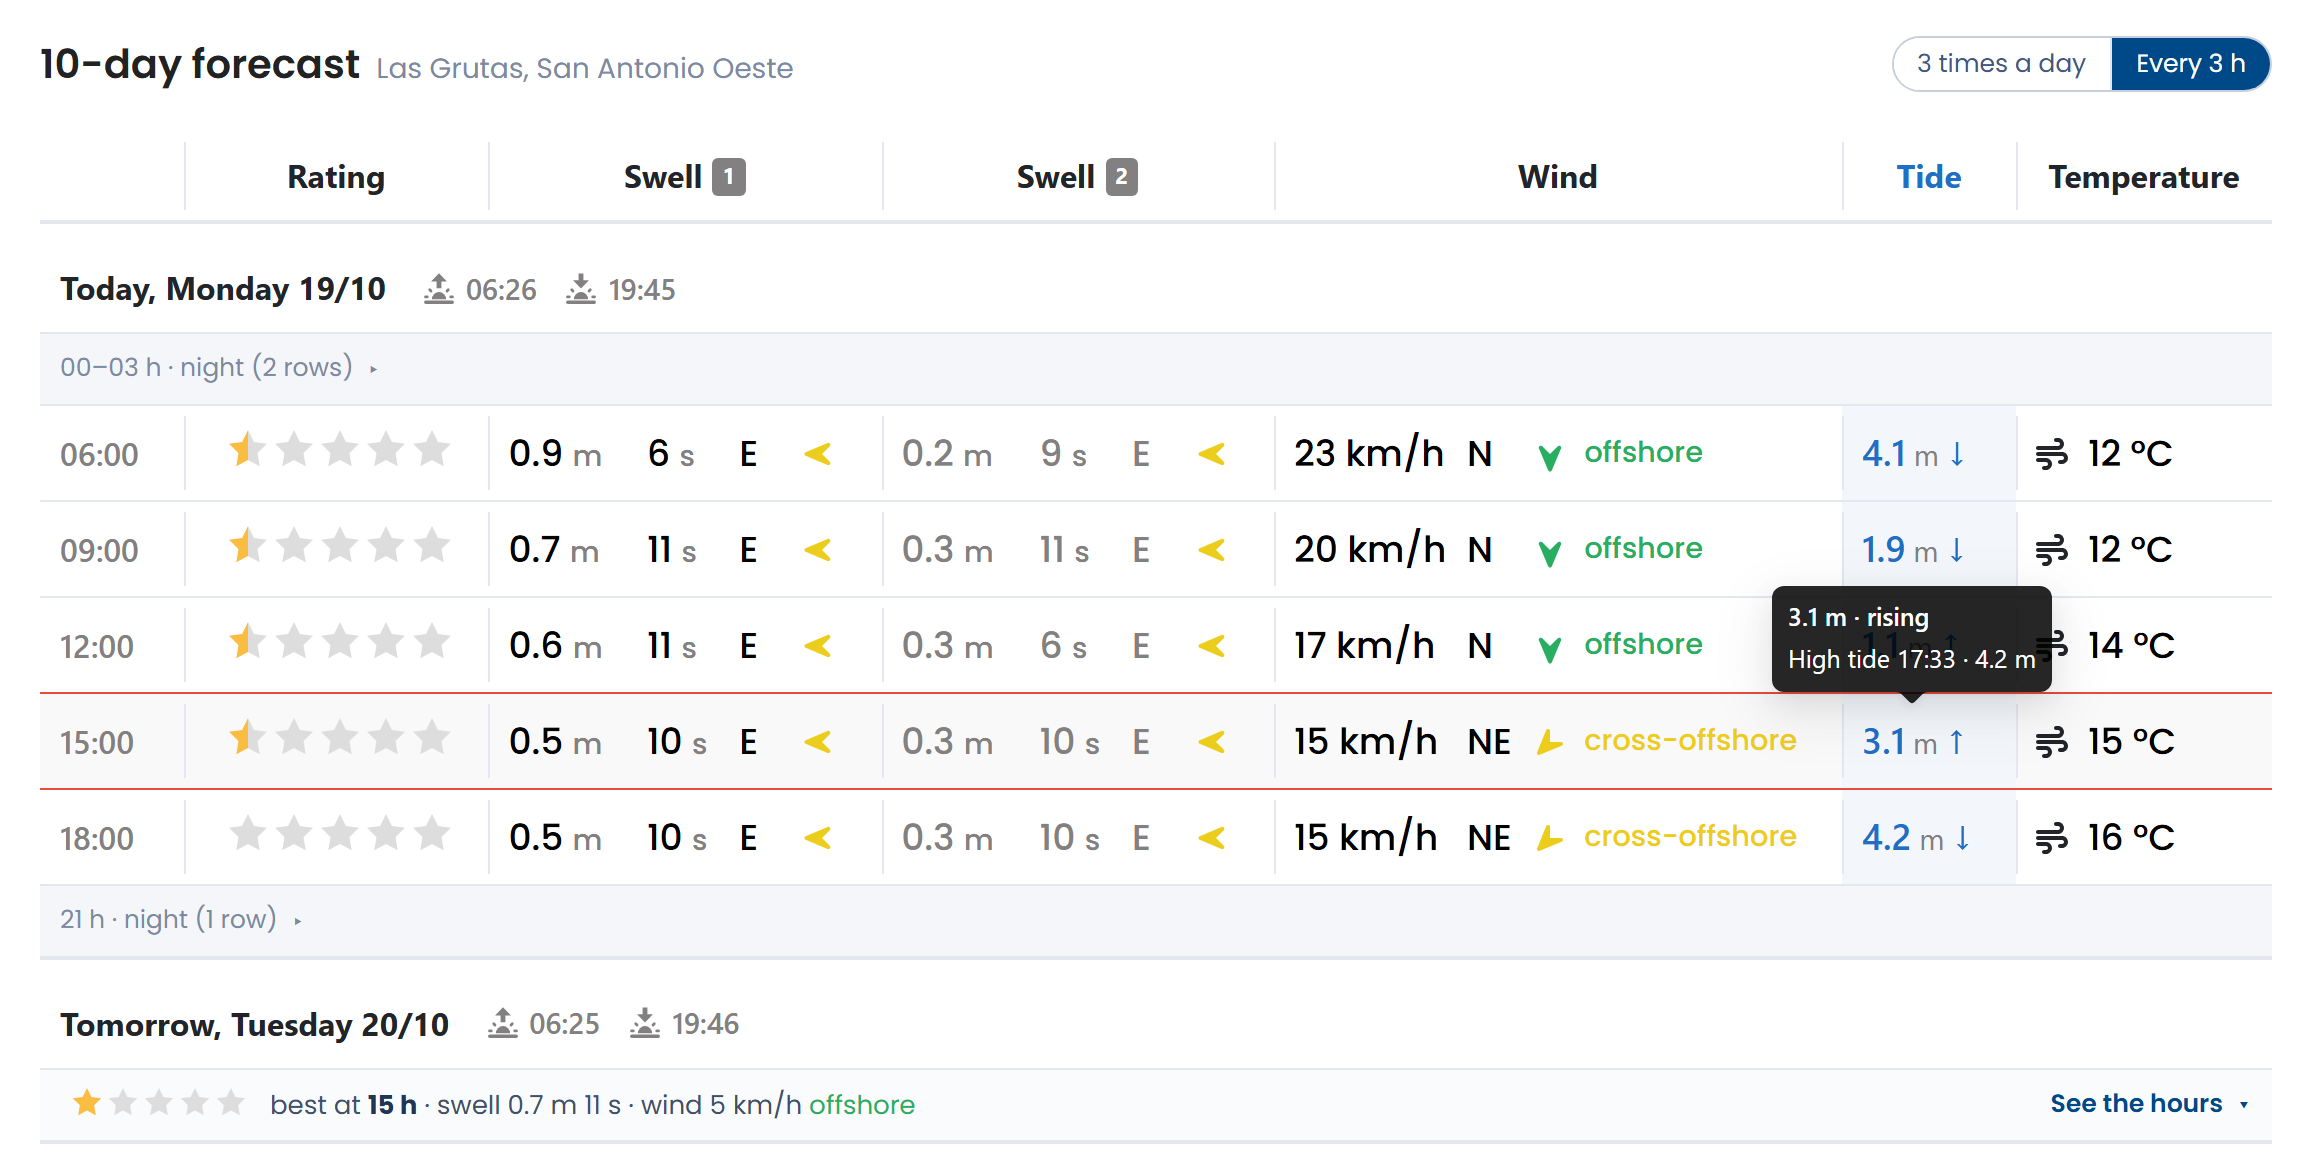
That way you can see at a glance whether the best time for waves lines up with the tide that works for your spot.
Every beach's tide, on the web too
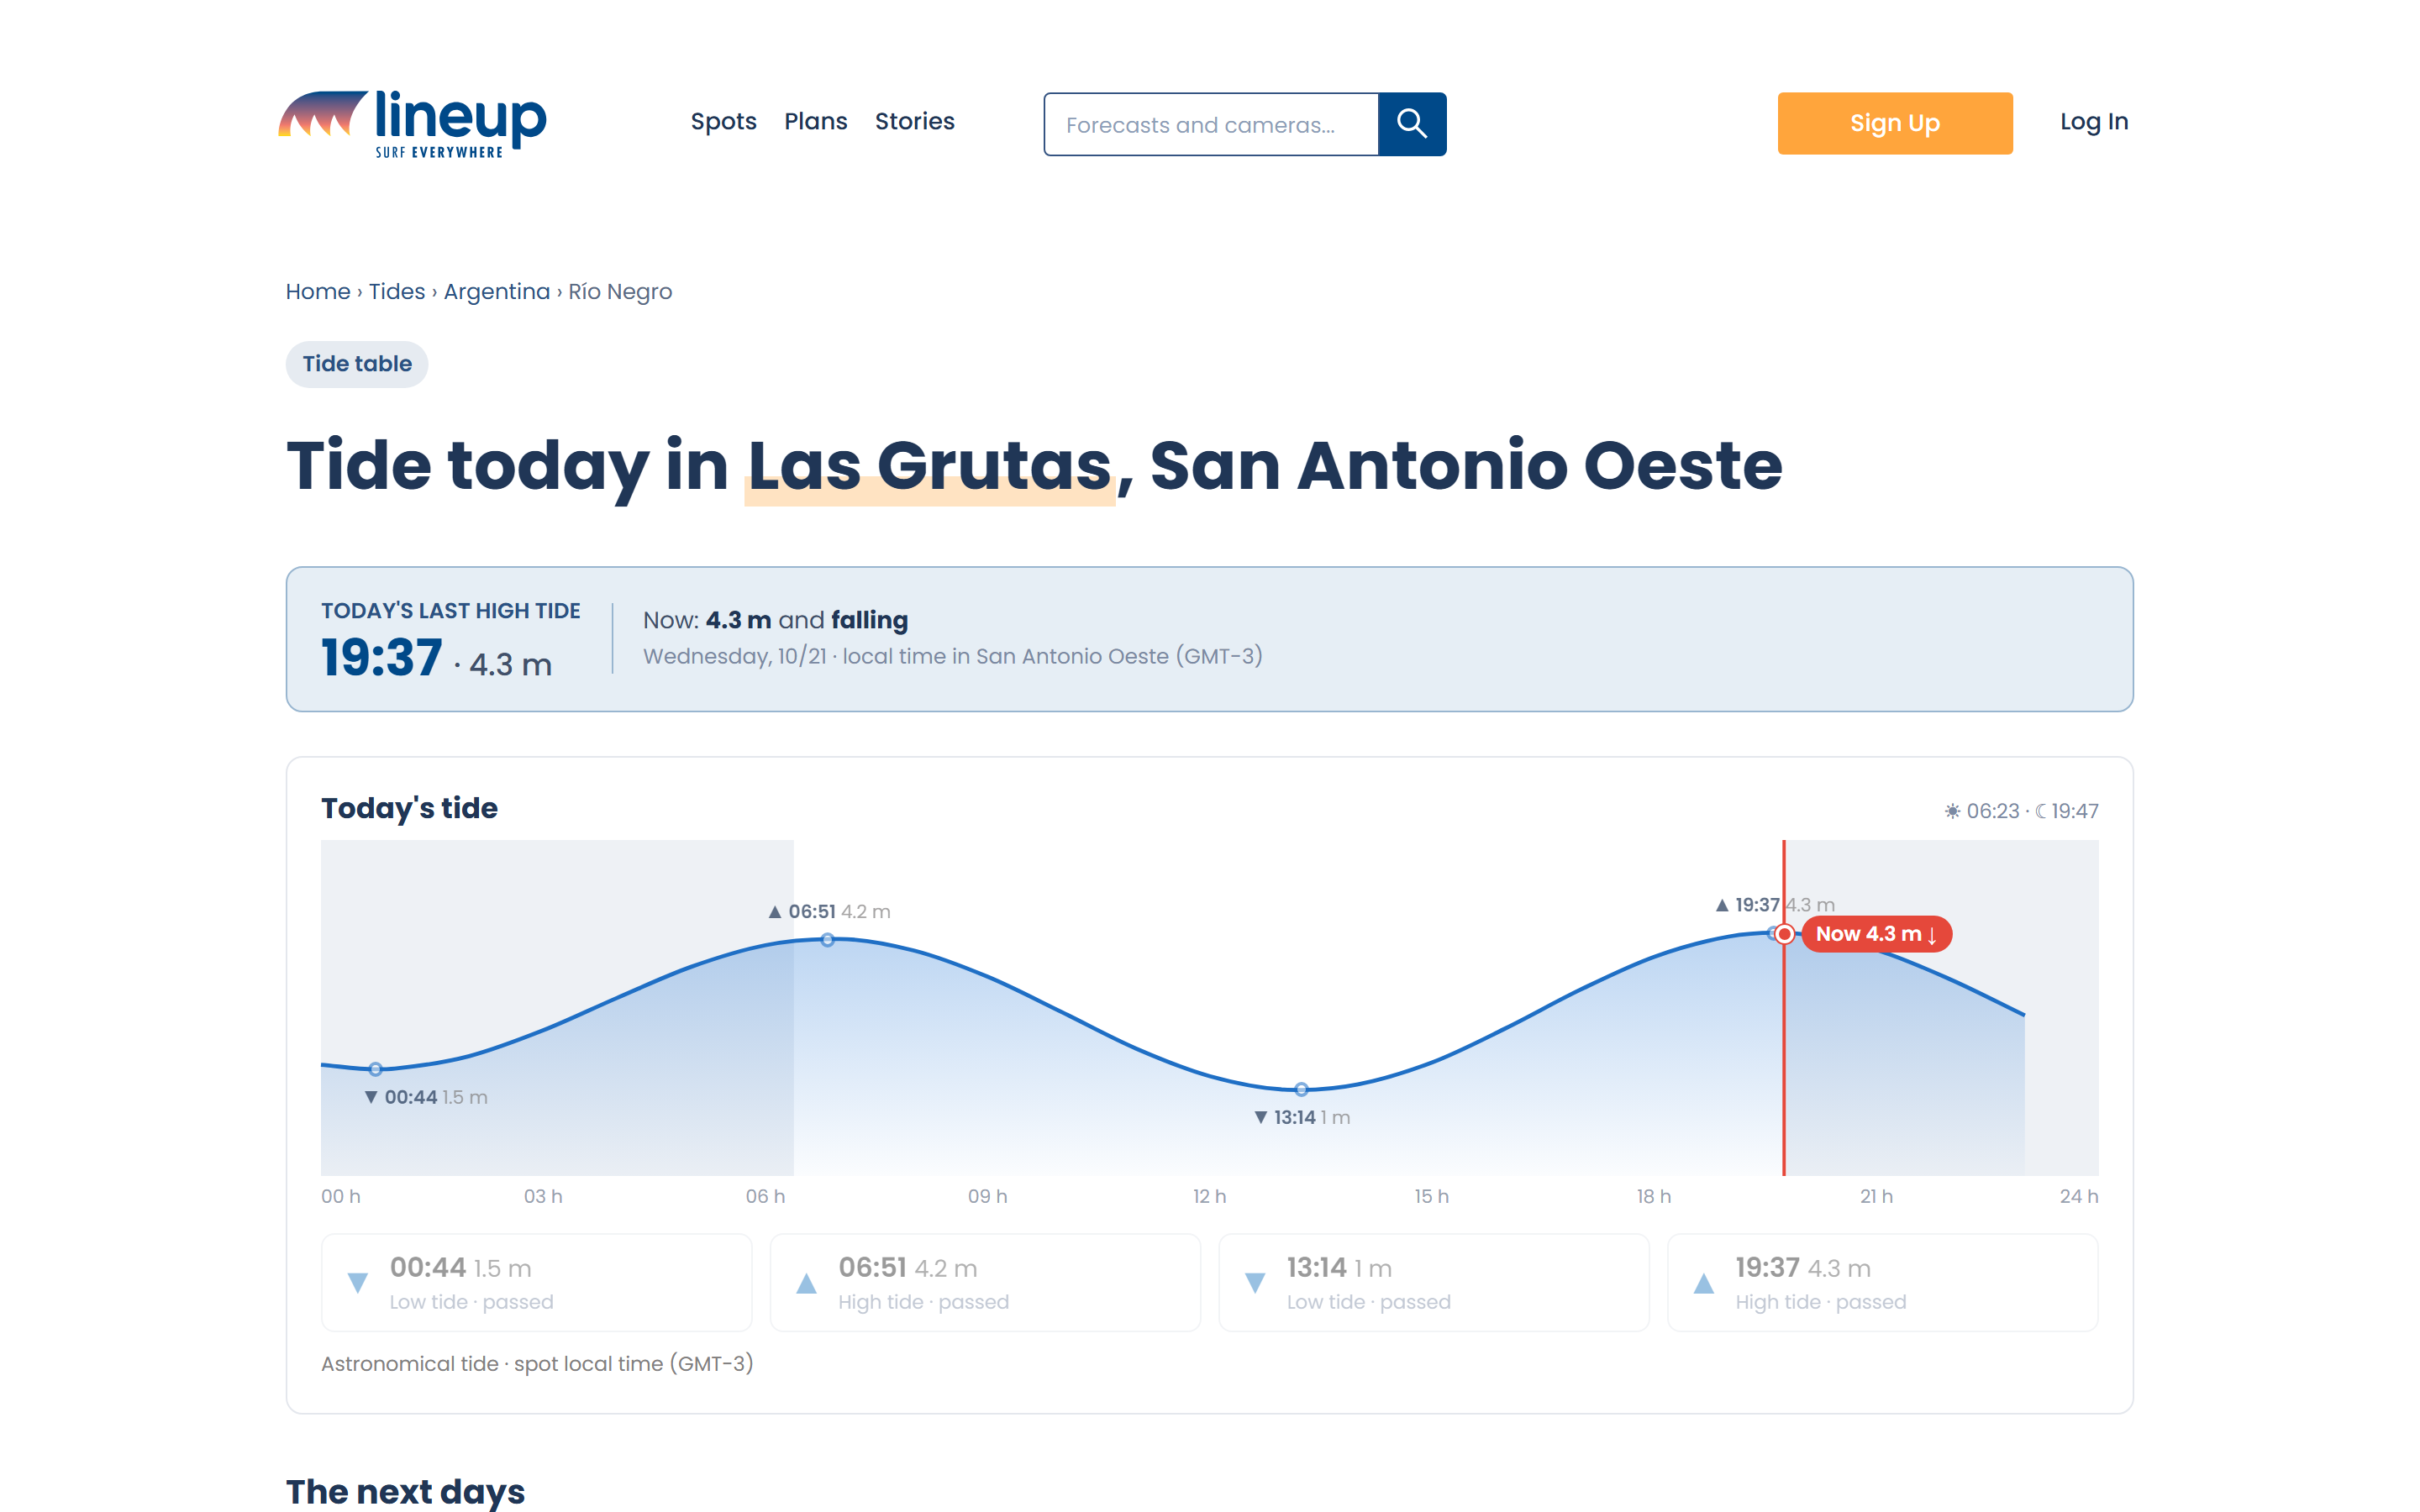
If you want to check a beach's tide without opening the spot page, there's today's tide table, beach by beach and in local time: lineup.surf/en/mareas.
What does each plan get?
- Free: today's tide, on the spot page, in the forecast and on the web.
- Premium: the tide for all 10 days of the forecast.
Look up your spot's tide and see what time works best to paddle out.