Over the past few decades, years with a warmer-than-normal Pacific have brought some of Chile's worst climate disasters: the Quebrada de Macul mudslide in Santiago in 1993, and the March 2015 rains in Atacama, with an abnormally high freezing level, that devastated Chañaral, Copiapó and Diego de Almagro.
No two El Niños are alike: where the ocean warms, how much and for how long all change, and that determines which coasts get rain and which breaks get swell.
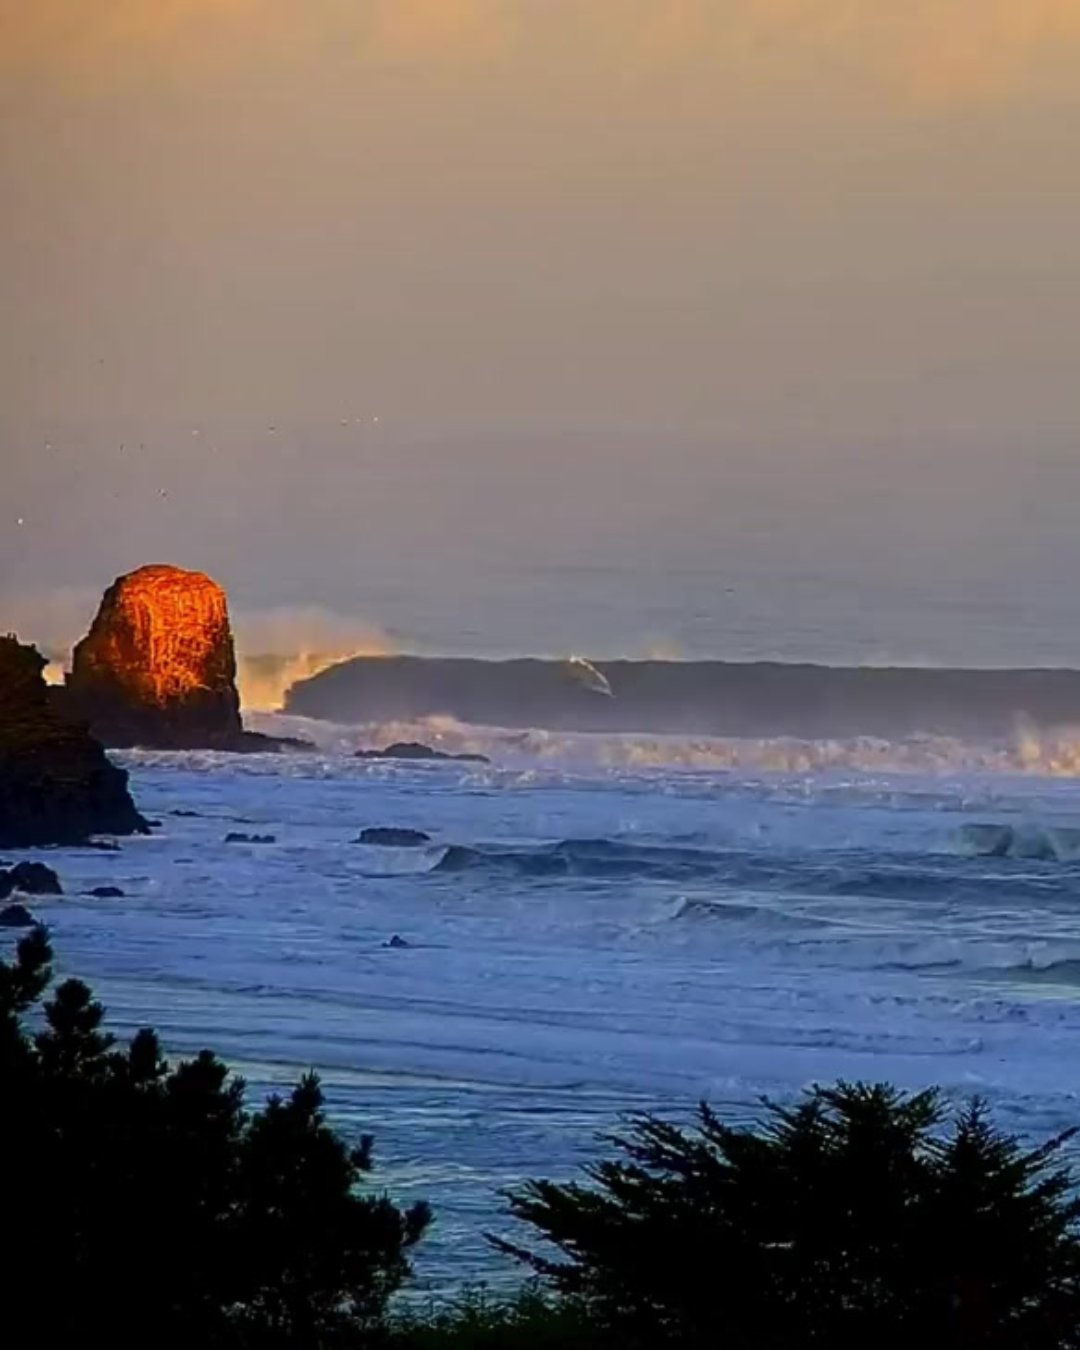 Punta de Lobos taking one of the biggest swells of 2026. Lineup Cam Rewind.
Ocean Memory: The 2009 Milestone
The 2009–2010 El Niño took hold during the second half of 2009 and peaked between the end of that year and the first months of 2010. It was a moderate-to-strong event. At its peak, in December 2009, North Pacific swells reached Hawaii and allowed the Eddie Aikau to run at Waimea Bay.
That day, Chilean surfer Ramón Navarro earned his place in Waimea history. On the live broadcast, an astonished Fredrick Patacchia searched his notes for the Chilean's name after an incredible drop that would earn him the Monster Drop Award. That day showed the courage of the Pichilemu native, and also something this article is about: a storm thousands of miles away, in the North Pacific, put a surfer from Pichilemu in front of Hawaii's biggest waves (a memory that, honestly, still gets me emotional).
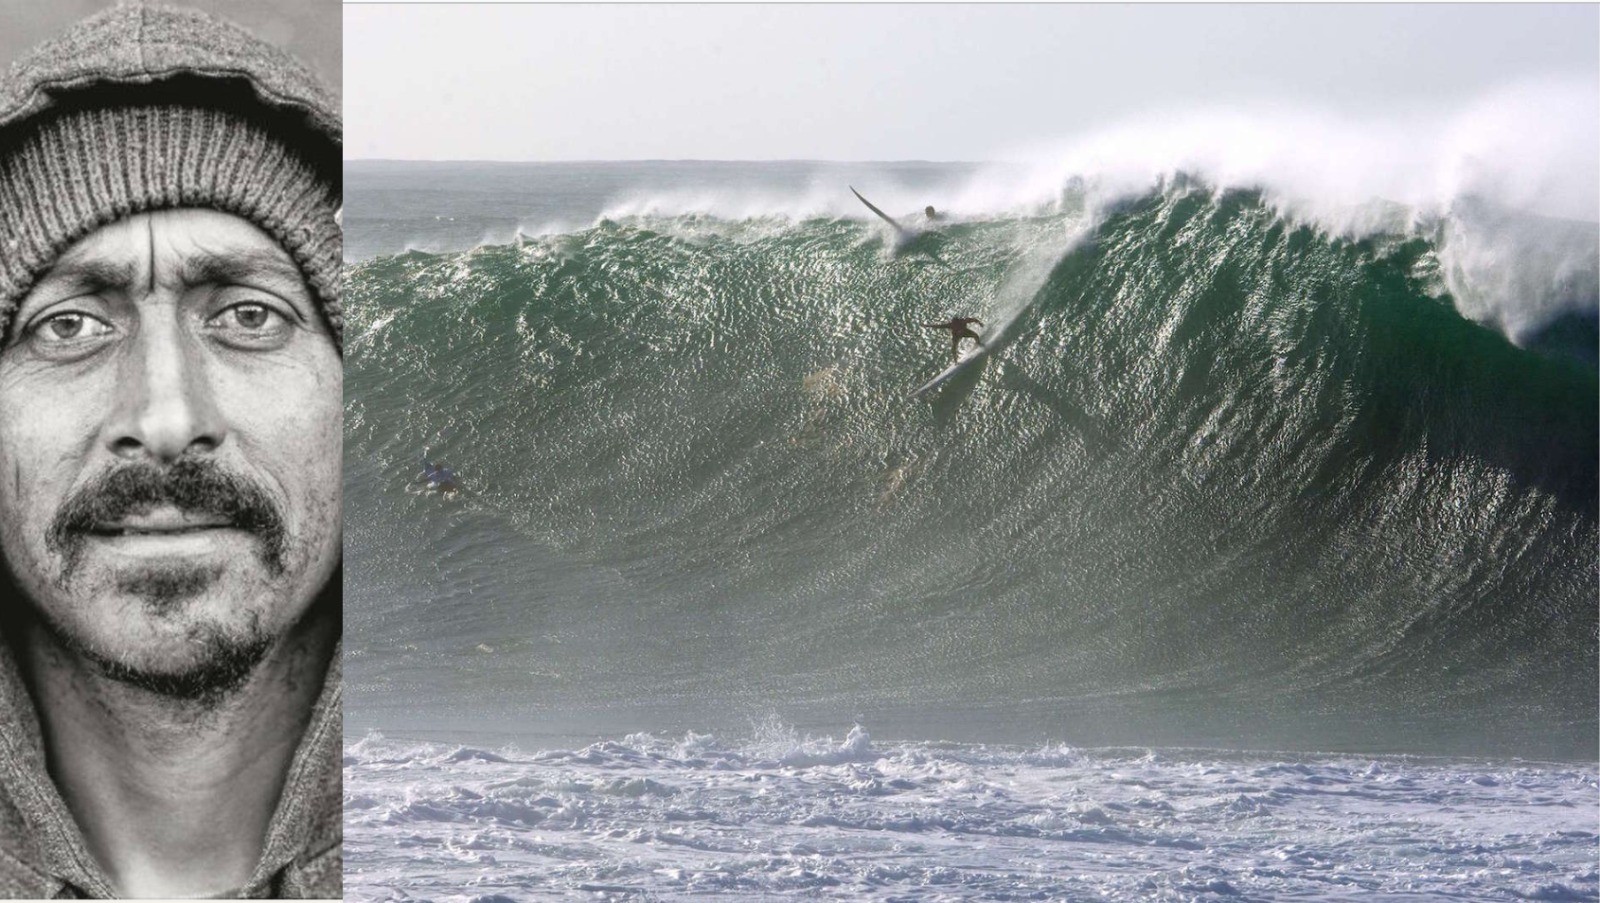 Ramon Navarro's Monster Drop at Waimea Bay in the 2009 Eddie Aikau.
The Current Scenario: The Arrival of the 2026 "Super El Niño"
Over the past few weeks, rains with a high freezing level hit northern, central and southern Chile. The question is what comes next.
According to the latest El Niño/La Niña Update from the World Meteorological Organization (WMO), published on September 3, El Niño is already established and over the coming months will become a very strong event, what the media call a “Super El Niño.”
The WMO puts the probability that it will last until February 2027 at nearly 100 %, with its peak toward the end of this year. In July of this year, the Niño 3.4 index, which measures how much warmer than normal the equatorial Pacific is, hit +2 °C, and in August it reached +2.6 °C. With those values, this event is shaping up to be on par with the 1982-83, 1997-98 and 2015-16 El Niños, the strongest on record.
What Determines a Swell's Energy
The energy carried by an ocean wave in open water depends on the interaction between the wind, the distance and the time spent in the storm zone (fetch).
Wave height (H):
This is the factor with the biggest impact. A swell's energy and power grow in proportion to the square of its height. If a wave's height doubles, the energy it carries is multiplied by four.
Swell period (T):
This is the time in seconds between one crest passing and the next. A long period means a longer wavelength, which lets the energy travel faster across open water and reach deeper into the water column. That's why, at the same height, a 14-second swell brings almost twice the power of an 8-second one.
Water density ρ ≈ 1025 kg/m³) and Gravitational Acceleration (g):
These are practically constant values. In the formula they act as multipliers that convert wave height into energy per square meter of surface:
E = 1/8 · ρ · g · H²
With a 2-meter wave, that comes out to about 5 kJ per square meter of ocean.
How Waves Change Along the Pacific Coast
The warming of the equatorial Pacific shifts the usual storm track. That changes which coasts get swell, which direction it comes from and how often, from Alaska to Cape Horn.
What to Expect in Chile and Peru
In a normal summer, Chile and Peru get less swell and calmer seas than in winter. With this "Super El Niño," the season will bring more frequent, longer-period swells. El Niño intensifies North Pacific winter storms, and those swells reach Peru and northern Chile during our summer.
At our point breaks (like Punta de Lobos in Pichilemu), beach breaks (like La Serena, Maitencillo or Reñaca) and rocky reef breaks (like El Gringo in Arica or Las Urracas in Iquique), long-period swells can shift sandbars in just a few days and change how each spot breaks. On top of that, El Niño raises sea levels along the South American coast, so swells push farther up than usual.
Outlook for the North Pacific
In the Northern Hemisphere, a stronger jet stream will fuel more intense and more frequent storms than normal during the winter, with big swells for Alaska, the US West Coast, Hawaii and Mexico. Spots like Mavericks, Waimea, Jaws or Todos Santos could have an intense season, with more damage to coastal infrastructure and more erosion.
The Impact on the Planet and Global Warming
El Niño also alters rainfall and temperatures far from the Pacific, and its effects vary by region and time of year. The southern United States tends to have wetter, stormier winters. In southern Africa, the December-to-March rainy season tends to be drier. In South Asia, El Niño usually weakens the June-to-September summer monsoon, reducing rainfall in India and the region; the Sahel also tends to get less rain in those months. In Indonesia and Australia, dry conditions increase the risk of wildfires.
El Niño is a natural phenomenon and, according to the WMO, it is not caused by climate change. But this episode is happening in the middle of global warming, caused by human activity through the burning of oil, gas and coal, and that makes its effects worse. El Niño's heat adds to a higher baseline temperature, which is why strong El Niño years tend to break global temperature records. In addition, a warmer atmosphere holds more moisture, making extreme rainfall more intense. Whether global warming also changes the frequency or strength of El Niño is something scientists are still researching.
Summer Safety Protocol
This summer, beaches in Chile and Peru will be packed right when the ocean has more swell and stronger rip currents than in a normal summer.
Before Paddling Out, Follow These Golden Rules
- Watch the water for at least 20 minutes: Take the time to study how the sets are behaving, spot the channels where the rip current flows and locate the impact zone before going in.
- Ask locals and lifeguards: Lifeguards, surfers and fishermen know the hidden bathymetry, where the rocks are and recent changes in the sandbars.
- Check our technical reports: Look at tide trends, wind direction and swell energy to avoid surprises or sudden changes in conditions during your session or swim.
This summer could bring swells you don't see every year. Check the forecast, choose carefully where and when to paddle out, and make the most of them.
See you in the lineup.